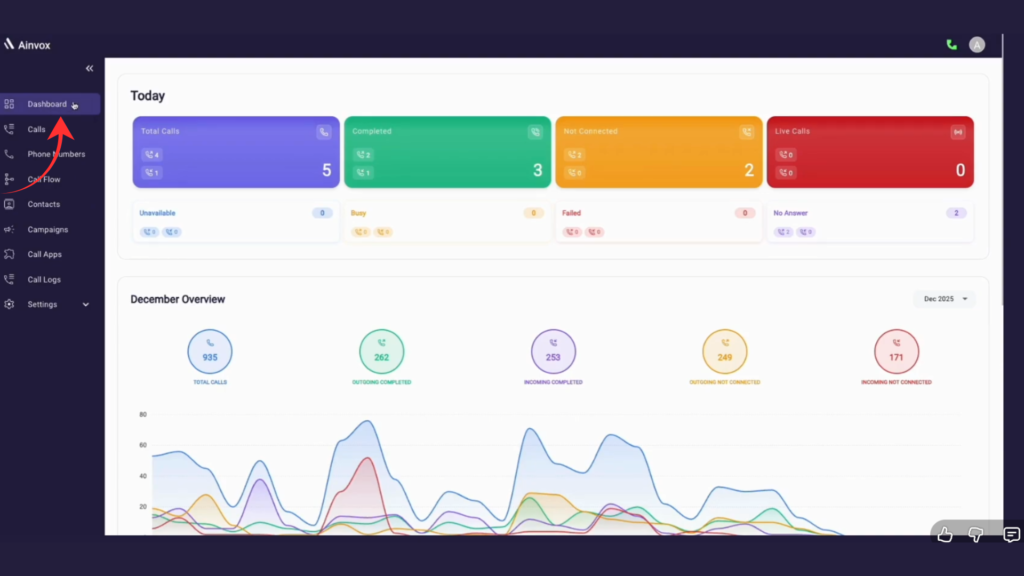
Step 1 : click on dashboard
The Ainvox Dashboard gives you a quick overview of your call activity. It shows today’s total calls, completed, not connected, live calls, and other statuses like busy, failed, and no answer. The monthly overview displays total inbound and outbound call
performance with a trend graph. It helps you monitor and manage your entire calling system from one page.
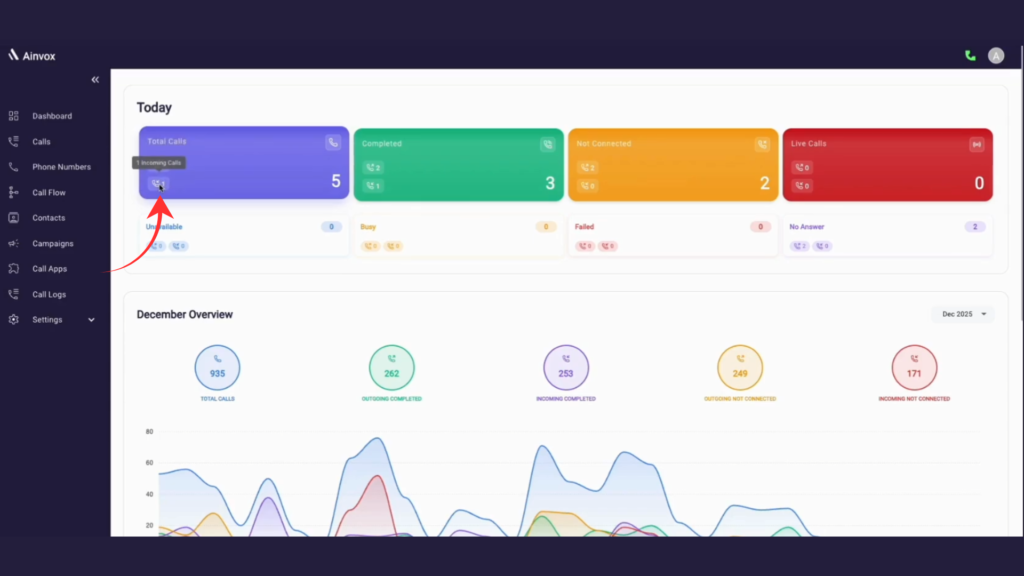
Step 2 : click on outgoing and incoming call section
The dashboard shows total calls, with completed and not connected. There are no live, busy, failed, or unavailable calls, and 2 calls were marked as no answer.
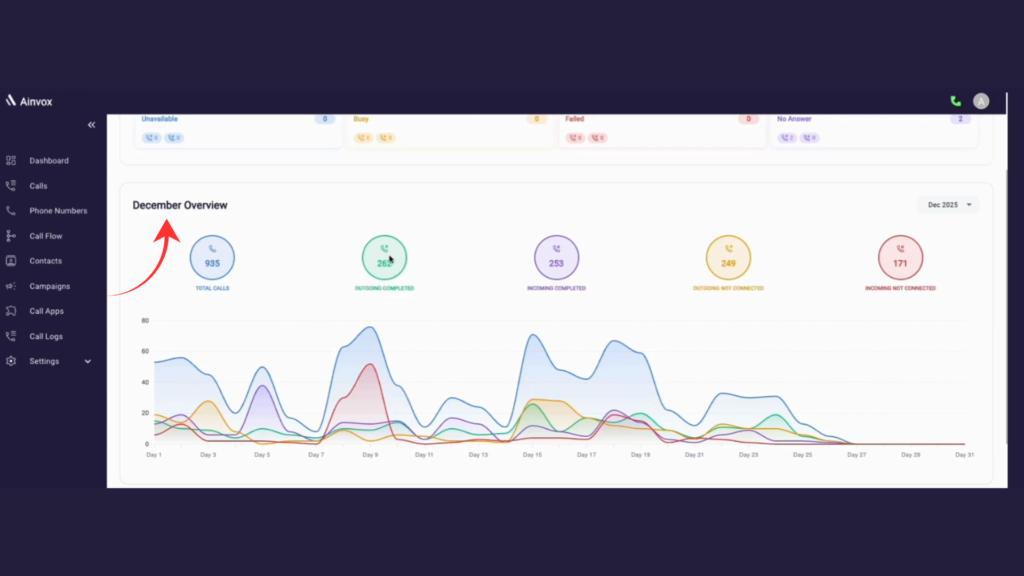
Step 3 : december overview
The December Overview shows total monthly calls (935) with a breakdown of completed and not connected incoming and outgoing calls, along with a daily trend graph to track performance.
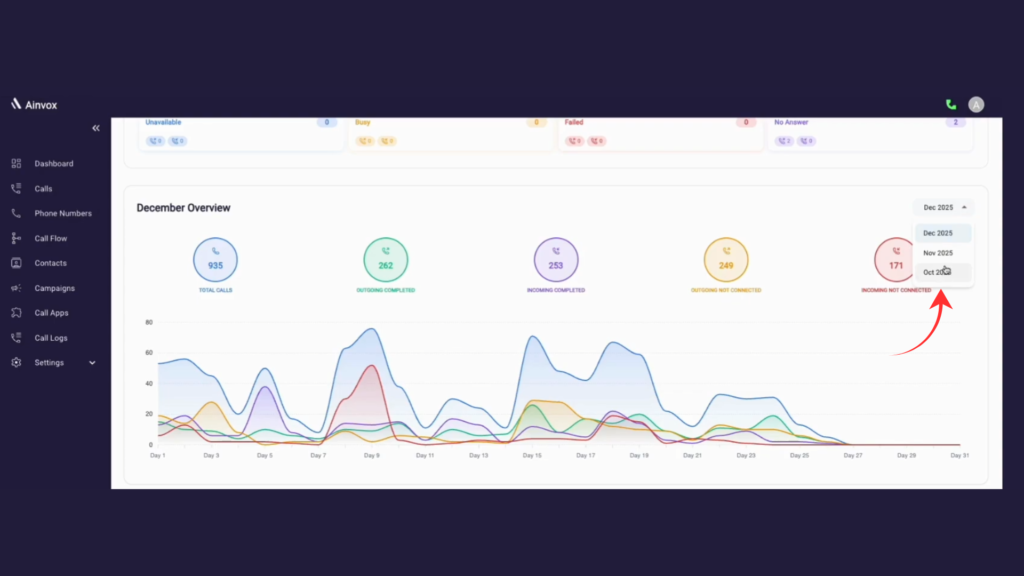
Step 4 : click on filter option
The filter option in the December Overview lets you select a specific month (e.g., Dec 2025, Nov 2025). Once selected, the dashboard updates call stats and the trend graph for that month.
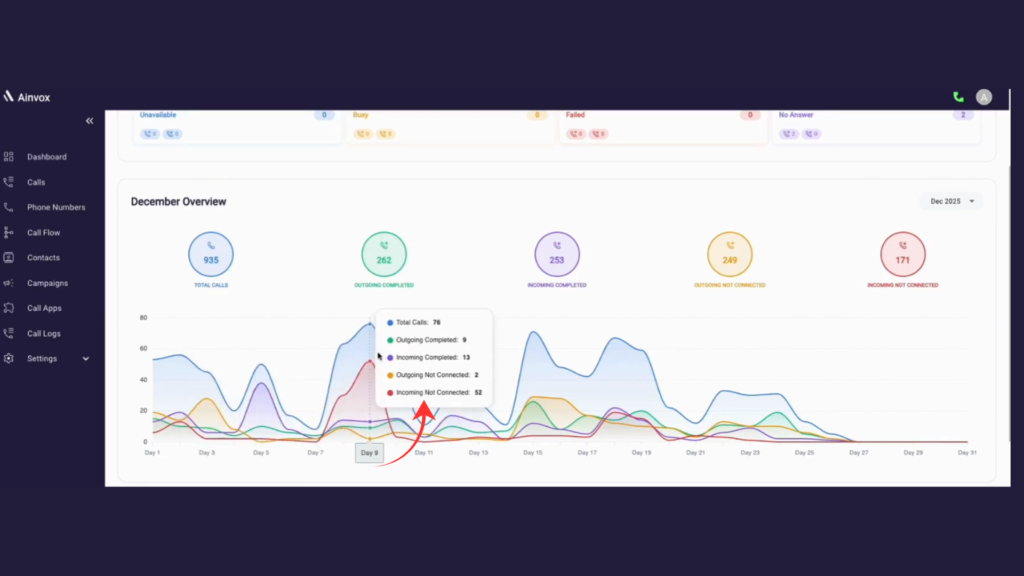
Step 4 : graph shows
The graph-specific location shows the call details for a selected date, including total calls, completed calls, and not connected calls for both incoming and outgoing.
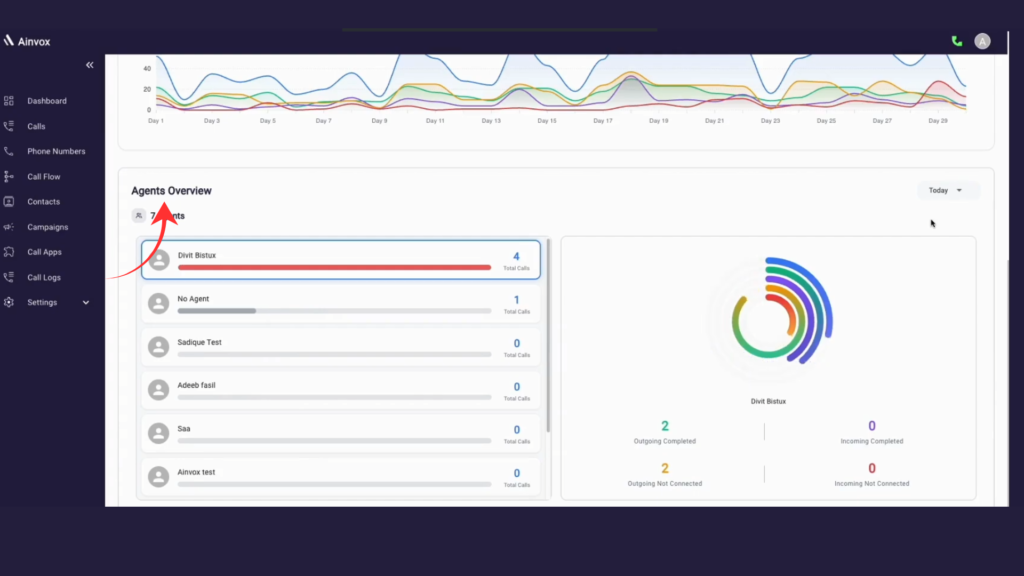
Step 5 : agent overview
The Agents Overview shows each agent’s total calls with a progress bar and stats for incoming, outgoing, completed, and not connected calls, along with filter options for easy analysis.